Tracking funnels in Google Analytics – Part IV
In my previous post, I described how I use Google Analytics for tracking multi-visit/session funnels when the order of the events/steps is significant. The solution is a small JavaScript code that stores the information about the navigation path in a custom variable. It does so in order to keep track of the events already sent.
Before showing you what can be done with the custom variable, there is something important I would like to explain:
When a user visits a mapped page or event, the tracking code stores the relevant character in the user’s custom variable. If the user visits a page/event that is part of a defined funnel, the tracking code sends a fake pageview for the relevant funnel, as well as storing it in the custom variable.

If we look at the funnel “ABC”, we can segment this funnel using one of two dimensions:
1. Page:

2. Custom Variable:
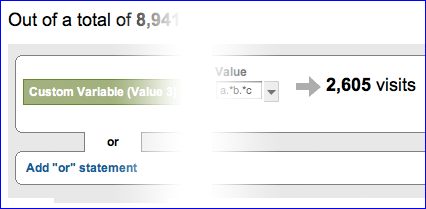
Both of these dimensions result in a different number of visits:
- Based on the Page dimension, the number of visits is 2,048, which is the number of unique visitors who performed this event in this specific funnel.
- On the other hand, based on the Custom Variable dimension, the number of visits is 2,605, which is the number of ALL visits of users who performed this event in this specific funnel.
With Google Analytics, you cannot actually segment all visits made by users who have completed a specific goal, unless you store this information in a custom variable (visitor level). If you want to segment people who visited page B and you have a user that visited pages A and B in one visit, and then visited page C in a second visit, GA will only show you one visit (the first one).
As you will see later in this post, segmenting based on the custom variable, however, makes much more sense in some cases, as in this example it will show you two visits which is the overall activity of this user.
Funnels as Segments
Being able to see ALL visits is an extremely powerful tool and you can create segments for each of your funnels. Let’s take one of the funnels from a previous post – Users who viewed the “Plan Page” to convert:
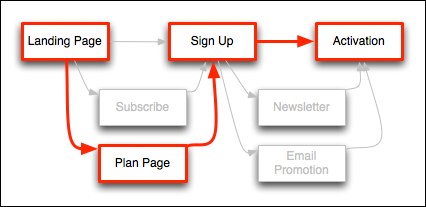
If you only want to see people who signed up after looking at the “Plan Page”, then you can create a segment that only includes people who have AEBC in their custom variable.
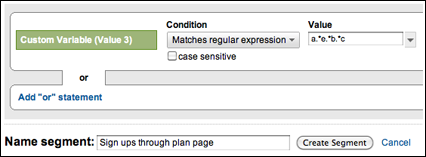
In this manner, you can create a whole list of segments based on your various funnels:
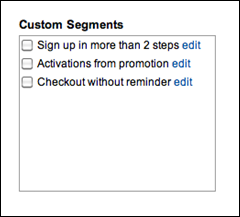
Once you have the segments defined, you can use GA to view “regular” goals by segment. For example, if you have a goal for “Checkout” (which may occur more than once per user), you can see how many Checkouts you have for each of your funnel variations, including the Checkout conversion rate for people who went through the “Plan Page” vs. people who signed up directly from the landing page.
In the following screen shot you can see that I have created two segments: “Sign ups directly from landing page” and “Sign ups through plan page”. I also have three goals “Start Trial Period”, “Paying User” (when a user switches from trial to a paid plan) and “Extend Trial Period” (when a user asks for an additional trial period).
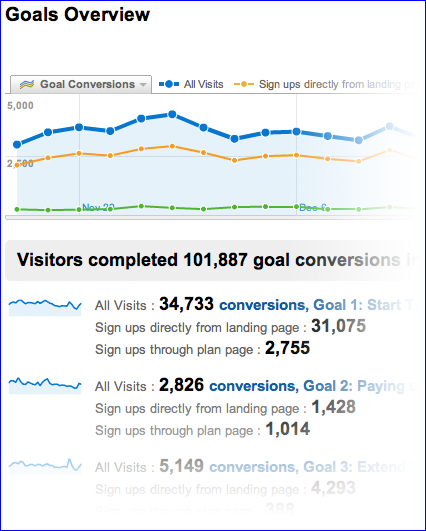
As you can see, only 7.9% (2,755 out of 34,733) of my trial users went through the Plan Page. On the other hand, 35% of all of my users who become paying users (1,014 out of 2,826) signed up through the Plan Page. I believe the reason is that these users started the trial period already knowing how much they would have to pay for the service after the trial.
If your funnel is a multi-visit funnel (meaning that on average it takes more than one visit to convert), then creating a funnel as a segment and applying it to your report will include all visits AFTER the user converted as well as the actual visit during which the user converted.
Please note that you can create segments for any funnel you can think of, and you do not even have to define the funnels in the tracking code as described in my previous post.
Funnel Exploration
Most web analytic tools and services that provide a funnel analysis assume that you know your funnel, while there is a good chance that in actual fact you have all kinds of popular “long tail” funnels, which are really just variations of the main basic funnel.
Therefore, storing the path in a custom variable enables you to view all of your variations and identify popular funnels or micro funnels that you were not previously aware of.
Let’s say your funnel is ABC and you have created a “Basic Funnel User” segment, to include only users who go through all 3 steps:

When viewing your Custom Variable Report and looking at the paths people used you might find micro funnels that are popular enough to become part of your basic funnel, or you might want to change the flow according to these findings.
In this example the second most popular funnel is ADBC (after the basic funnel ABC), which means that users first subscribe and then sign up. Note also that the conversion rate from Landing Page to Activation is much higher when the user first subscribes.
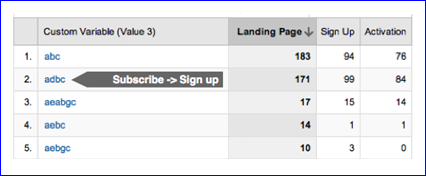
You may wish to further learn about a specific funnel or funnel subset, to learn more about the behavior and outcome of users who went through that path. Here, for example, you might want to check if there are any common denominators, such as traffic sources or countries. You can do so by creating a new segment – “Custom Variable (Value 3)” = “A.*D.*B.*C” – and applying it to any of your GA built-in or custom designed reports.
If you have an e-commerce site you can even connect specific funnels and micro funnels to revenues. This way, you might find specific paths that have a lower conversion rate but actually produce greater revenues.
* Please note that it can take up to 72 hours for data to be shown in the custom variable report. Although the data will not show up in the report, it will be available in the advanced segmentation interface.
Funnels on the fly
You can apply the method published on the ROI REVOLUTION BLOG (an excellent post) about how to create funnels on the fly using Google Analytics.
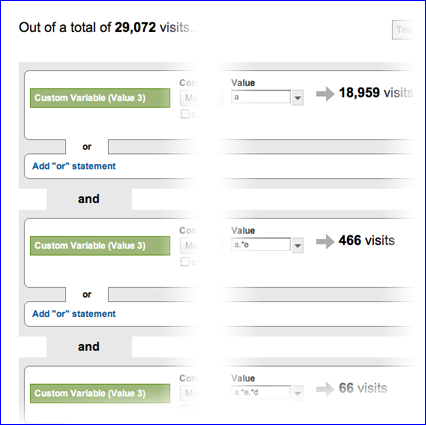
Let’s say we want to check how many people first viewed the Plan Page, then subscribed and only then signed up:
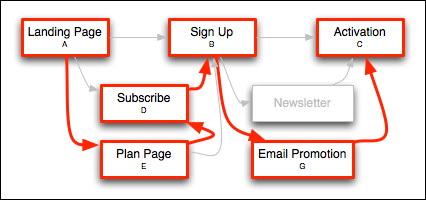
Although goals for this funnel were not set up, we can obtain a visual funnel using the advanced segmentation:
AB Testing and Funnel Comparison
You can use the same trick for comparing pages as part of an AB testing experiment:

By assigning a different letter for each Sign Up page (for example, original = B; variation 1 = X), you can create two segments:
For the original Sign Up page:

And for variation 1:

When you choose these two segments and look at the “Activation” goal, each segment will show you how many activations came through the original page (first segment), and how many came through the variation (second segment).
Just One small Reservation…
It seems that there is a discrepancy between segment by Page and segment by Custom Variable. Theoretically, if you create a segment by page (Page A) and a segment that combines both Page and Custom Variable (Page A and Custom Variable match “A”), then Google Analytics should present the same amount of visits for both segments (as the tracking code updates the custom variable accordingly, prior to sending a fake pageview)
However, for some reason, this is not the case. When I tested this manually, by performing visits and pageviews to a test site, there was a perfect match – both segments presented the same amount of visits. However, with real sites that have thousands of visits and users per day, I usually see a gap of about 15% between the two segments.
While this gap should not have any effect on your data, I am still investigating it and will post an update if I find that the problem is with the tracking code.
Reservations aside, the only thing left now is to show you how to implement this on your site. I will publish the code in my next post and describe a basic methodology that I use on my sites for analyzing and exploring funnels.
Click here to see how to implement this solution on your site





 Follow @cardiolog