Understand your SharePoint and Microsoft 365 Data that Matters Most

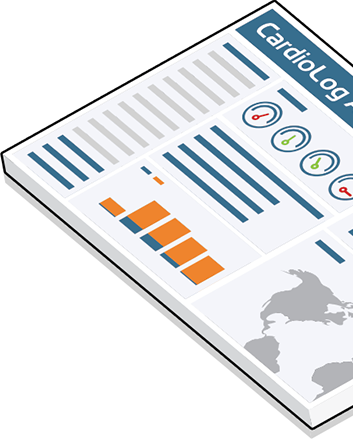
WHAT IS WEBSITE ANALYSIS?
 The two main methods for tracking websites and monitoring site usage statistics are JavaScript page tagging (CardioLog’s method) and Log File Analysis (SharePoint’s method).
JavaScript aggregates data from the client side, while Log File Analysis aggregates data from the Server-Side.
Log File Analysis creates files that accurately store any kind of event on a site, whereas JavaScript-based tracking (also referred to as Page Tagging) collects events from the browser, such as clicks and mouse movements, and sends them back to the central server.
WHICH METHOD IS BEST?
Both methods merely aggregate data with different methodologies. CardioLog’s JavaScript tracking is more logical to the end-user. SharePoint’s log-file analysis will track a page view by including every element on the page (pictures, videos and embedded data).
This feature can be configured by the CardioLog Admin. The combination of tracking only authentic human interaction and omitting black-listed users provides a more precise picture of which users are interacting with the portal
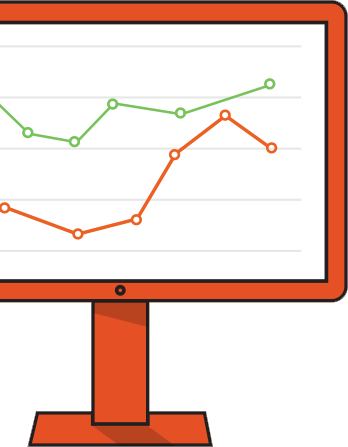
EVENT TRACKING
You may be wondering which method is most effective for tracking your SharePoint sites. Both methods simply aggregate data, yet utilize different methodologies. CardioLog’s JavaScript tracking is more logical to the end-user because it specifically tracks authentic human interactions on a page. Alternatively, SharePoint’s log-file analysis tracks a page view by including every element on the page (including pictures, videos and embedded data).
When leveraging log-file analysis, one-page view will populate in SharePoint’s analysis as ten different page views. CardioLog Analytics counts every element on the page (pictures, videos, and embedded data) as one-page view as a way of providing more meaningful business insights. By consolidating these events into one concise page view, the process of tracking page views is simplified to reflect more intelligent results.
USER TRACKING
 When tracking users, SharePoint tracks automated back-end processes (non-human activity). These automated processes include: timer jobs, search indexing, and other such processes administered by SharePoint (not a human being).
This means that these automated processes will be seen as “unique users” according to SharePoint, CardioLog Analytics only tracks authentic human interaction, and has the ability to black-list users who will not be tracked.
These black-listed users are generally administrators, programmers, or anyone who is making technical changes to the site.
This feature can be configured by the CardioLog Administrator. The combination of tracking only authentic human interaction and omitting black-listed users provides a more precise picture of which users are interacting with the portal.
 |  |
|---|---|
 REPORTS DOWN TO A SHAREPOINT SINGLE DOCUMENT | REPORTS ONLY TO THE SHAREPOINT SITE LEVEL |
TRACKS USER BEHAVIOR (MOUSE AND BUTTON CLICKS) | NO USER BEHAVIOR TRACKING FEATURES AVAILABLE |
TRACKS ONLY HUMAN VISITORS | TRACKS BOTH HUMAN VISITORS AND NON-HUMAN PROCESSES |
ADVANCED FILTERING | LIMITED FILTERING OPTIONS |


CARDIOLOG ANALYTICS
FILTERING FEATURES – TREE STRUCTURE
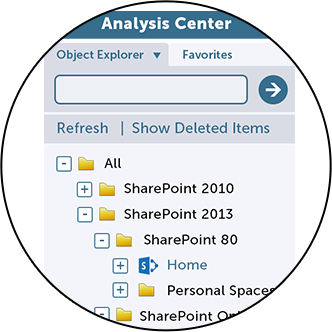
WHAT IS A TREE STRUCTURE?
 The CardioLog Analytics Tree Structure Filtering feature helps you build a complete view of all of your content that exists within your SharePoint environments.
This content grouping and drilldown tool offers intelligent and interactive ways to visualize your data.
CardioLog Analytics automatically categorizes individual pages according to the site map of your intranet portal. Because it is based upon the site structure, content drilldown enables you to get interactive reports that allow you to drill deep into a specific section or sub-section of your site – all the way down to the level of single pages and documents.
ARE YOUR NUMBERS SLIGHTLY DIFFERENT IN CARDIOLOG’S TREE STRUCTURE?
 Sometimes one site can be seen by an end-user in multiple views depending on how the SharePoint administrator has configured it.
In CardioLog’s tree structure, each site is only represented once, and different views can be merged by the fine-tuning process CardioLog Analytics provides. Our support team is always available to assist you in any specific inquiries you may have about this process.