
Wouldn’t it be nice if you could just pleasantly unload a bunch of Viva Engage (Yammer) portal content on a scale and weigh it in one go, just to get a sense in physical weight what all of your content contributions are worth? Likewise, wouldn’t it be ideal if you could use one powerful tool that digitally collects and measures the usage data of your organization’s content contributions within your SharePoint Viva Engage (Yammer) platform, ranging from PDF files, Microsoft Word documents, audio and video files, jpeg and more? No problem, portal pros! CardioLog Analytics’ Content Contributions Report for Viva Engage (Yammer) outweighs any other option to acquire this data.
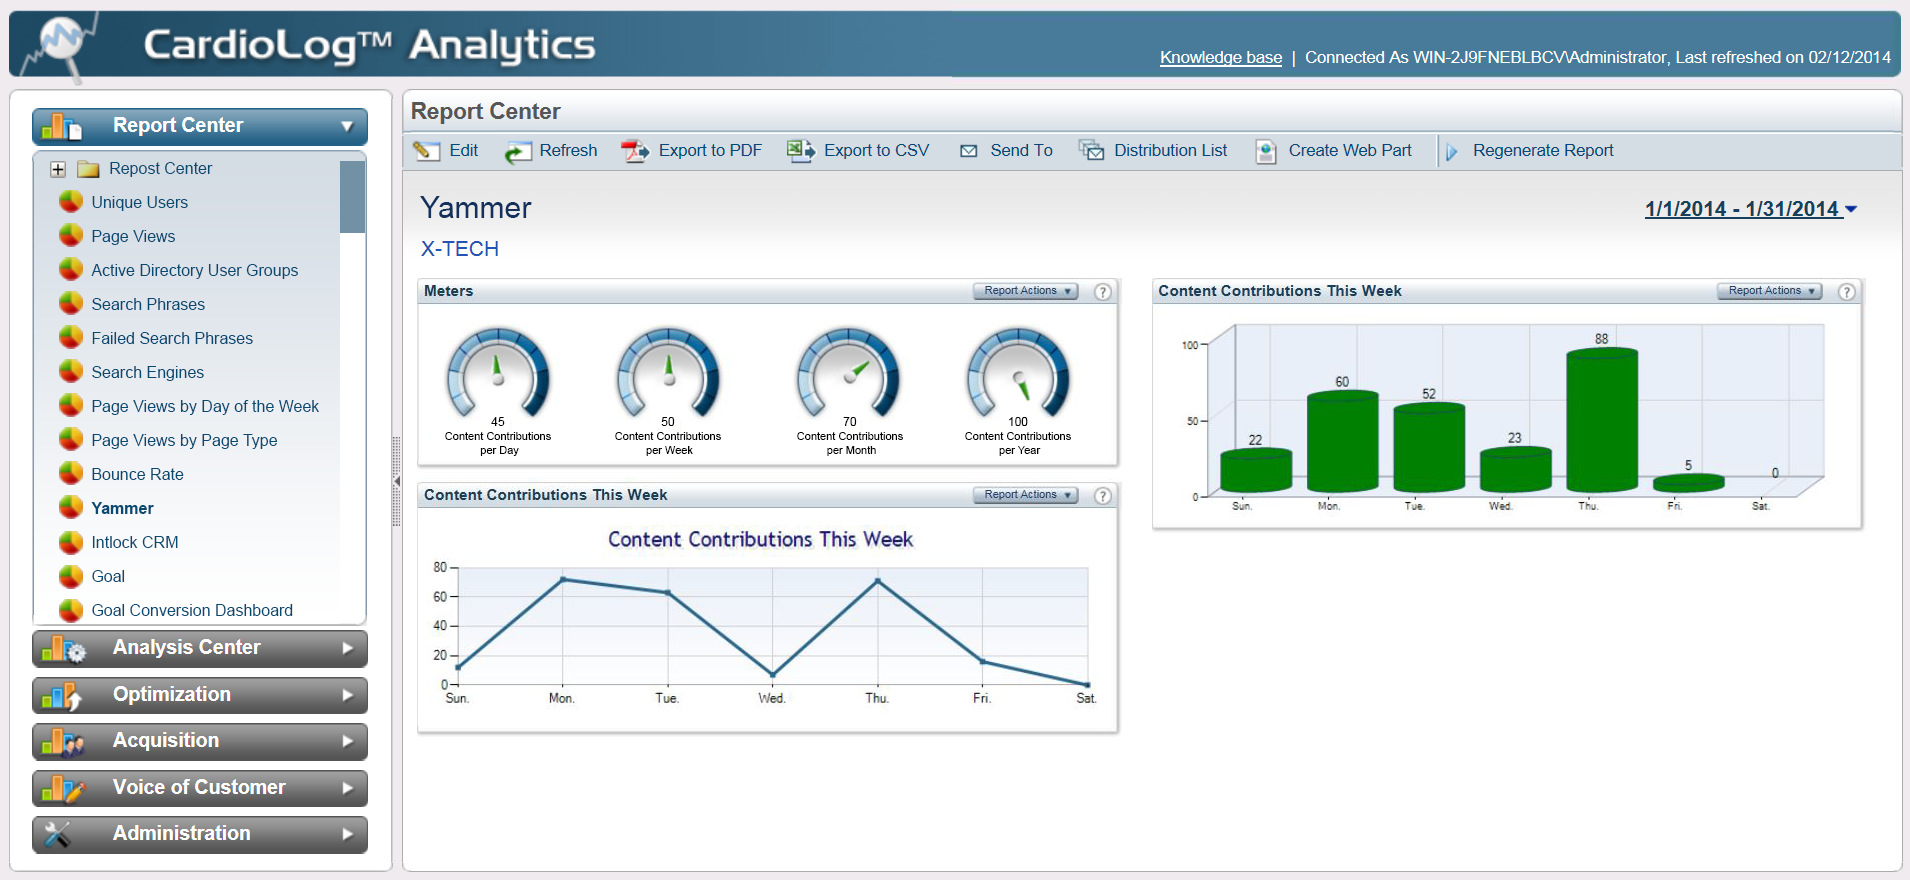
CardioLog Analytics’ Content Contributions reports provide a plethora of insights regarding your SharePoint Viva Engage (Yammer) environment’s content added. These reports allow you to generate statistics that indicate how many content contributions are made hourly, daily, weekly, monthly, quarterly or even annually. With two user-friendly widgets, a meter and chart, CardioLog Analytics can easily offer insight on the data on your most precious content that’s being contributed to your SharePoint Viva Engage (Yammer) platform. After you’ve assessed what type of content is being contributed in the largest sums and what the growth rate of specific content files are over a period of time, you can transform your portal into an efficient platform that hosts relevant content.
| Next Feature >> Influential Content |