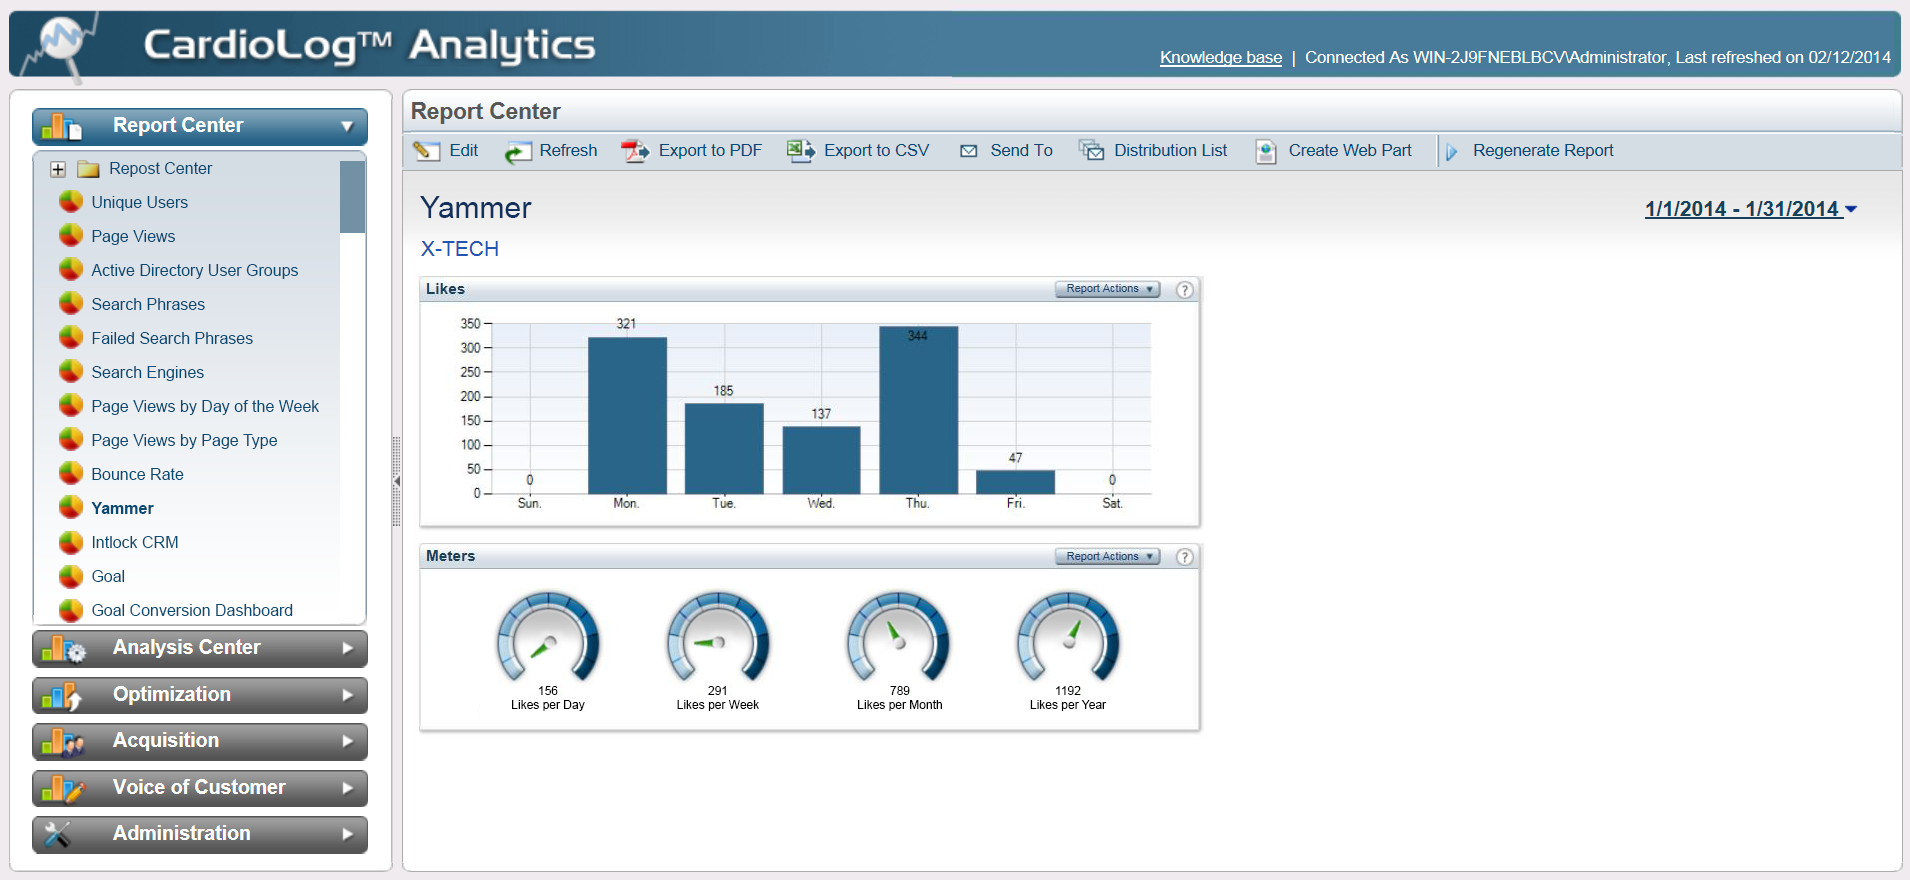
Smart marketers know that when customers like something on any social platform, its public image and relations take a jump and usually hype starts to spread. Positive feedback from the public can give a nice jolt to the popularity of any consumer good or even content item exposed to viewers and users of any website. Your SharePoint Viva Engage (Yammer) platform is no exception, and measuring the total number of likes your portal has acquired is simple with CardioLog Analytics Viva Engage (Yammer) Likes Report.
The bulk of your Viva Engage (Yammer) likes within your SharePoint portal are measured with either a meter or chart option with the option to diversify the visualization of your data, all within one dashboard. Both widgets offer the facts on how many total likes your SharePoint Viva Engage (Yammer) platform carries, measured over time, with the time period options ranging from hourly, daily, weekly, monthly, quarterly and annually. Find out how many thumbs up your company’s SharePoint Viva Engage (Yammer) site has collected, and learn more about its usefulness, accessibility as a high-quality resource, and its caliber as a hub for social interaction, collaboration, and engagement.
| Back to >> Viva Engage (Yammer) Social Reporting |


